
A. BMM’s Desktop#
This section provides an explanation of how to recover BMM’s data collection workspace after restarting the computer.
This is made a bit easier if a couple of symbolic links are made in
~/bin/. If not already done, do this at the command line:
ln -s ~/.ipython/profile_collection/startup/consumer/run-consumer ~/bin/run-consumer
ln -s ~/git/BMM-beamline-configuration/tools/run-cadashboard ~/bin/run-cadashboard
A.1. Monitoring#
To have eyeballs on the operation of the beamline, we want Phoebus
for engineering screens and the cadashboard application for the
heads-up overview of the state of the beamline.
- Phoebus (engineering screens)
There are two ways to start Phoebus.
The more hands-on way is to open a new terminal window or tab, the type
run-phoebusat the command line. This will open the Phoebus window and it should remember to place it on the top screen.It is not necessary to keep open the terminal window used to launch Phoebus. Phoebus is very noisy, spewing en endless stream of logging messages to the screen. Happily, it forks itself upon launch, so it is not necessary to keep that terminal window open. If you first opened a new window or tab, you can safely close it.
There should be an icon for Phoebus on the icon bar at the bottom of the lower, left screen. It looks like a red eyeball. Click on it.
Once Phoebus is open, if the layout was not restored, click on the “Window” menu, then on “Load Layout”, then select “Two cameras”.
- cadashboard
Open a new terminal window. Resize the window so it is a few lines tall, and the full width of the screen.
At the command line run
run-cadashboard. Make the font much bigger by hitting Ctrl-Shift-+ several times – maybe as many as 10 – until it takes up the full width of the screen.Resize the height to just cover the three lines of the dashboard. Move the terminal to the very top of the top screen. You can hide the window decoration by using Windows-
 to position the terminal window.
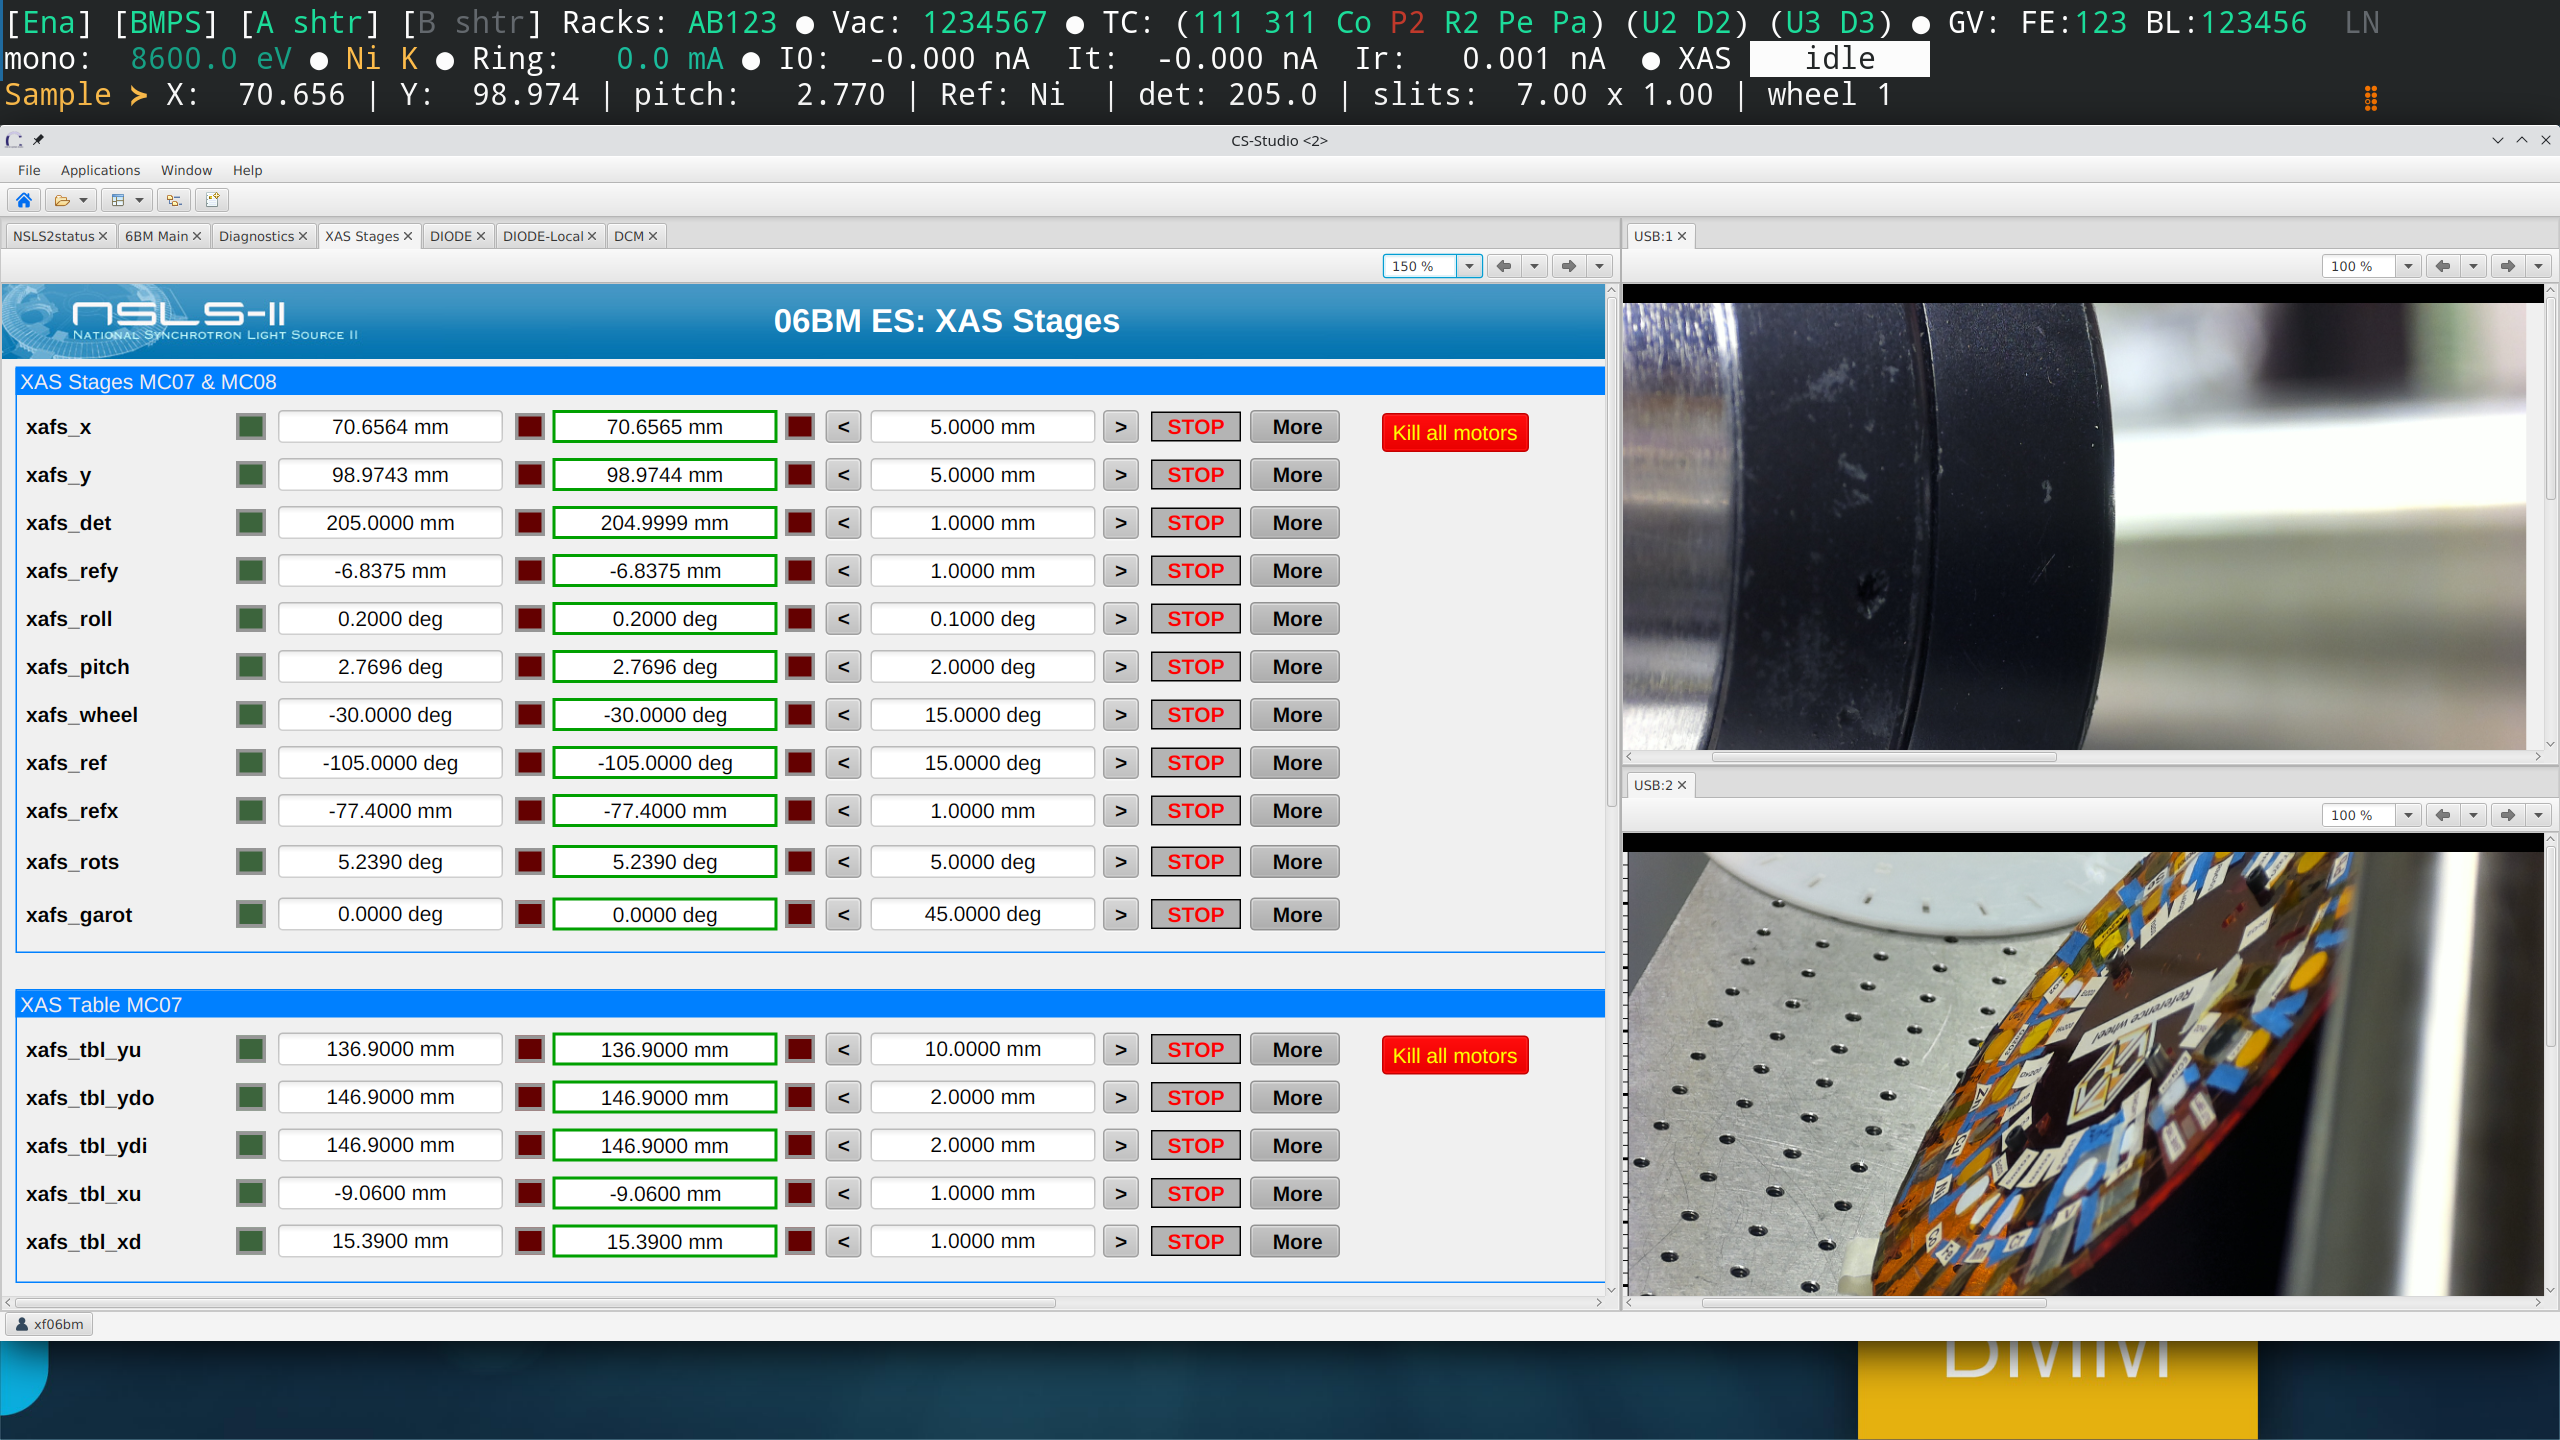
Fig. A.1 Once Phoebus and cadashboard are open, they should look something like this.#
A.2. Data collection and visualization#
Data collection and visualization are separate things and should be managed separately.
On the main virtual desktop, open a terminal window for bsui. At the
command line type bsui. bsui startup at BMM is rather
time-consuming, but after a couple minutes it is ready to go.
On the right-most virtual desktop, you will setup the Kafka file and plot workers as explained in the section on Kafka workers (Section C.1).
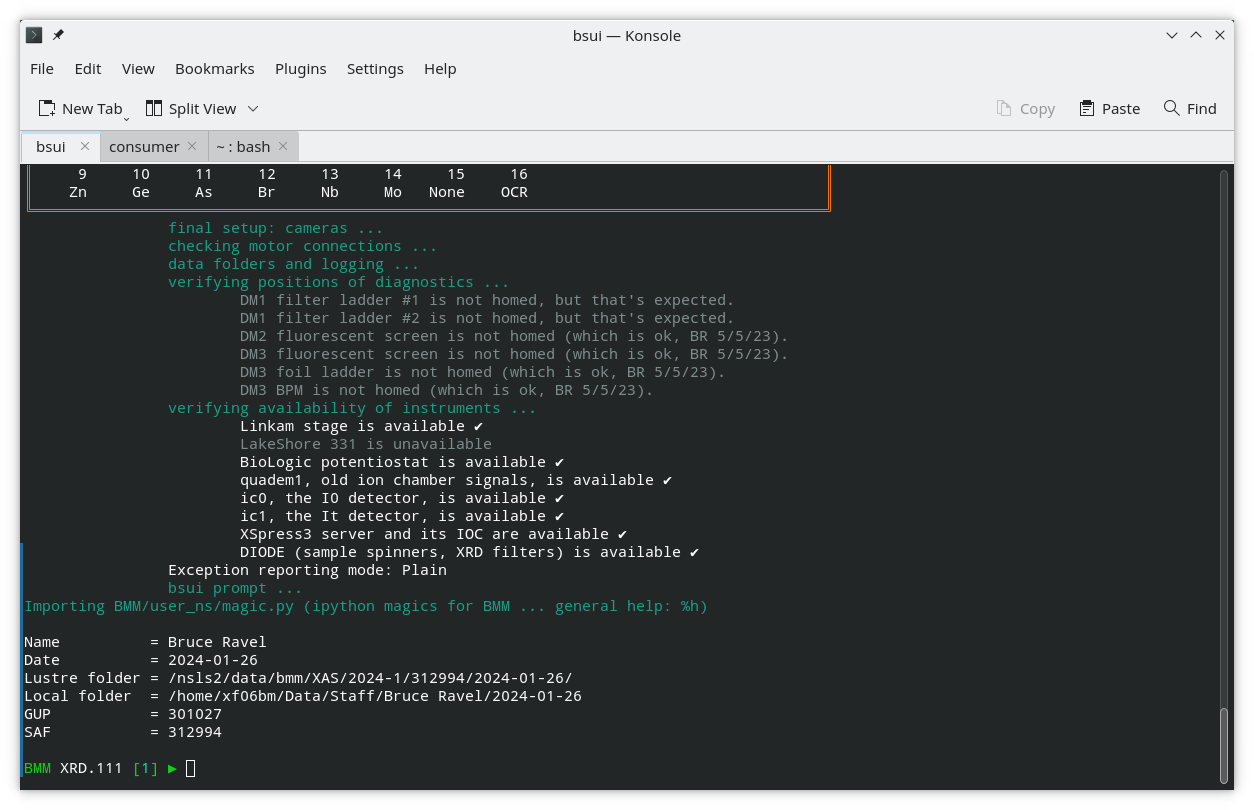
Fig. A.2 The tail end of the bsui startup messages and the command prompt.#
A.3. All the rest#
Some other things that are handy to have on the desktop during an experiment:
Firefox, with tabs open to the command cheatsheet (Section 15) and the XAS webcam.
Slack
A dolphin (file browser) window with a tab open to the current Workspace folder
Note that there is a button on the icon bar at the bottom of the screen for hephaestus.
In the new data security regime, launching athena as the beamline
account (xf06bm) is not very helpful given that it cannot access
the data.
If data are accessed by opening a terminal window and doing su -
<username> followed by authentication with password and DUO (see
section 4), first cd to the proposal directory,
then start athena with this command:
dathena > /dev/null 2>&1 &
That will open athena and suppress the large stream of uniteresting warning messages from the graphics tool kit.